Remove 2009 Remove 2021 Remove Accessibility Remove Education
article thumbnail

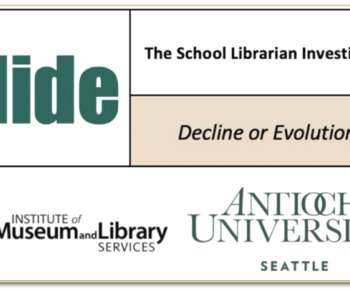
SLIDE: data, interactive tools, and an equity wake-up call (Part 1)

NeverEndingSearch

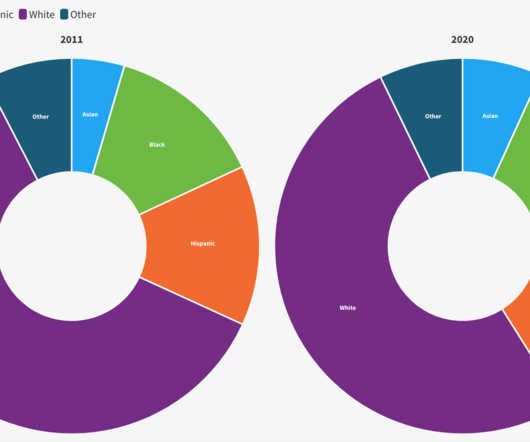
And soon, qualitative results will offer a better understanding of why educational leaders choose to make their school staffing decisions. almost 20% fewer than in 2009-10. Yet: In 2009-10, the national ratio of students per librarian was 939 to 1. Interactive digital tools will allow us to easily make comparisons.

Data 123
article thumbnail

OPINION: To solve teacher shortages, let’s open pathways for immigrants so they can become educators and role models

The Hechinger Report

As our country continues to struggle with historic teacher shortages, we ought to consider an untapped pool of aspiring teachers: Young immigrants who want to become educators. Enrollment in New York State’s teacher education programs has declined by 53 percent since 2009.

Education 116
Insiders

Sign Up for our Newsletter

This site is protected by reCAPTCHA and the Google Privacy Policy and Terms of Service apply.

article thumbnail

PROOF POINTS: It’s easier and easier to get an A in math

The Hechinger Report

But as schools settled back into their usual rhythms in 2021-22, grades didn’t fall back to pre-pandemic norms and remained elevated. Department of Education documented rising grades on high school transcripts between 2009 and 2019, while 12th grade math scores fell on the National Assessment of Educational Progress (NAEP).

Analysis 139
article thumbnail

Empty Desks: Getting Chronically Absent Students Back to Class Is No Easy Feat

Edsurge

East Palo Alto Academy, a small charter high school, saw a chronic absenteeism rate of 199 out of 355 students (56 percent) during the 2021-22 school year, according to state data. Source: California Department of Education. percent) in 2021-22. In 2021-22, 6.5 In 2021-22, 6.5 Department of Education data.

Meeting 168
article thumbnail

PROOF POINTS: New evidence of high school grade inflation

The Hechinger Report

The latest is an analysis of more than 4 million high school seniors who took the ACT from 2010 to 2021. Another bad sign is that the grade inflation detected by ACT closely mirrors Department of Education research. points from a 3.0 – a B – in 2009 to 3.11 points from 3.22 (a B) in 2010 to 3.39 (a B-plus) in 2021.

Analysis 142
article thumbnail

PROOF POINTS: New higher ed data by race and ethnicity

The Hechinger Report

Students’ race and ethnicity affect their chances of earning a college degree, according to several new reports on higher education released in January and February 2023. When jobs are plentiful, many low-income students may join the labor force and defer their higher education. Here is the chart on the BLS site.

Data 103
article thumbnail

OPINION: Florida’s governor and the College Board do not get to decide how we learn Black history

The Hechinger Report

But white leaders have tried to restrict our education for centuries. Predominantly white legislatures in at least 35 states in 2021 began pursuing policies or laws that would restrict teaching about race and racism. We can and will ensure they have all the access to Kimberlé W. DeSantis’ playbook is plagiarized.

Study 107