

Maximizing Time with Data and Evidence-Enhanced Rotations at All Grade Levels
A Principal's Reflections
JULY 21, 2024
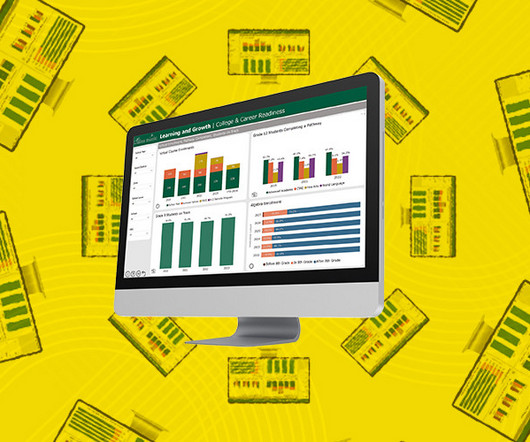
Here is where station rotation can be an invaluable asset as a data-enhanced teaching strategy to close learning gaps by maximizing the time available in class. Data or evidence is essential when using rotations. Integrate an adaptive learning tool to collect usable data and set students on an appropriate path.


Let's personalize your content