Personalized math learning is driven by data. This is why MIND Research Institute ensures ST Math educators are equipped with robust reporting capabilities and access to easy-to-understand information.
Valuable student data can be found at a glance in your ST Math Educator Console dashboard. Think of this location as your teaching command center. It's the central hub where you can find everything you need to:
Several reports, metrics, and graphs are included in your ST Math Educator console. Whether you are a site administrator, principal, math coach, or classroom teacher, signing in to the console at least twice a week will provide actionable data you can use to be proactive.
While the view will be slightly different based on your role at your site or district, you have the option to customize the dashboard based on your needs. Watch this short tutorial to learn more.
What it means: The Student Tab offers a snapshot of individual student progress in ST Math for the entire class. It's the first report and default tab when you sign in to the console and contains:
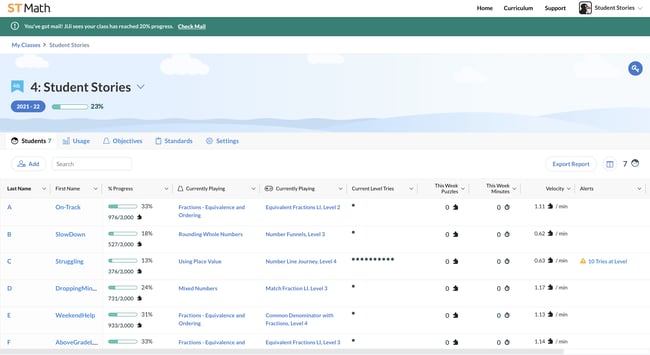
Why it's important: Think of this report as a roadmap to learning. The data housed under this section is ideal for understanding how students move through each level in their ST Math objectives. Here, teachers will find a high-level overview of these data points on one page for the entire class. When it comes to applying this data to personalize learning, teachers can use these insights to assess how quickly a student is progressing through the program, which students may need additional support, and know what concepts their students are interacting with. This aids the teacher in spotting trends and identifying the next steps.
What it means: This section is the activity log for each student. It's a great place to measure productivity to hold students accountable for their class's weekly Puzzle and Minute targets. Also, you can generate a Student Detail Report to share with math coaches, administrators, and families. Here, you can find:
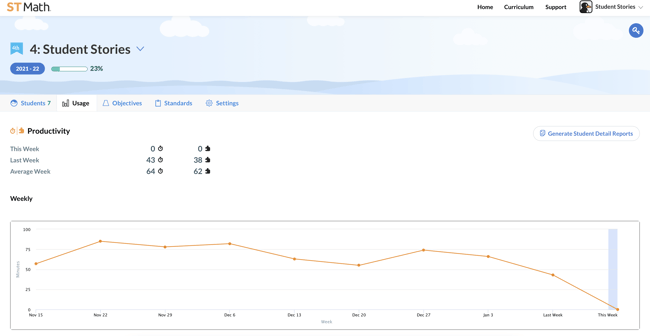
Why it's important: Studies have proven that time spent on ST Math improves testing gains, so it's essential to ensure that students, teachers, and administrators are consistently using the program to its full potential. This section displays student productivity in multiple formats such as a plot graph, line graph, and a weekly table. Here, you can gauge how efficiently the class is working through the content and how productive students are. In addition, the weekly sign-in table is an excellent resource for teachers to identify which students have signed in on any given day or week, how many minutes they spent for that session, and how many Puzzles were solved.
What it means: This section displays the two paths that students in grades TK-5 can play in ST Math. Under the two sub-tabs, teachers can view a student's Journey and Assignments. ST Math's Journey is the default experience for students and is designed to guide them through their entire grade level. Next to the Journey sub-tab is the Assignments sub-tab, which allows you to pick the objectives you want for the whole class or an individual student. Here you can find:
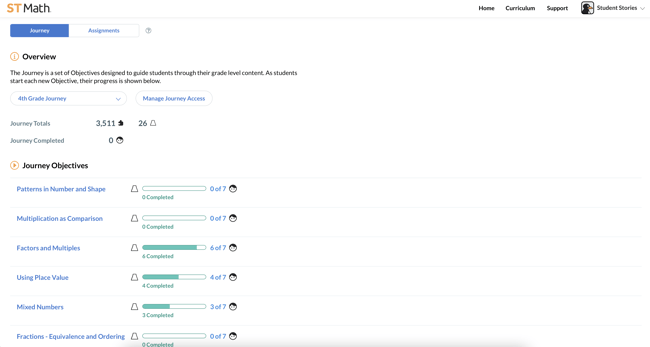
Why it's important: Practice makes perfect, and this section enables you to see which concepts need more review. This is where you can drill down to exactly what your students need help with. For example, suppose the whole class is experiencing difficulty adding fractions. In that case, you can assign additional practice problems without interrupting their grade-level progress. This section lets educators view their students' history and which objectives are completed or partially completed. Teachers can also manage the Journey access here. There is an option to turn the Journey off while assignments are available to specify the content students play.
What it means: This section covers how your students are performing concerning grade-level standards. Here you can find:
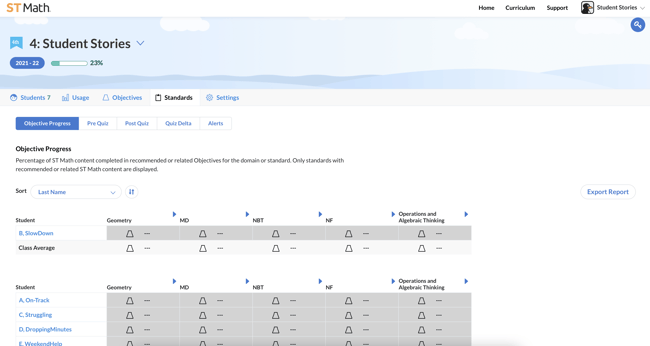
Why it's important: Teachers know how important it is for students to master grade-level standards. This console section provides a complete view of mastery and how students are progressing with grade-level content concerning ST Math objectives. All students grades 2+ will take a pre-quiz when they begin each Objective and end the Objective by taking a post quiz. Teachers can see their students' pre and post-quiz scores and view how much of a specific standard has been completed via the ST Math Objectives related to or recommended for each standard.
If you are a district-level administrator, the console will look slightly different. You have access to the Report Tab, which will provide a high-level overview of how each site performs in the district. This is a weekly report, but there is an option to see historical data for previous weeks in the year. Each site is hyperlinked and the data points for each grade and school include:
With all of this data available at your fingertips, now you can truly create personalized math experiences at the student, class, school, and even district level. The next time you have a parent/teacher conference or need to compile metrics for a meeting with administrators, look no further than your ST Math console.
If you need additional support navigating the reporting features in ST Math, or simply need a walk-through into what the metrics mean and how to use them, don't hesitate to reach out to your Education Success Manager or team.

Anita Delgado is an Education Success Manager at MIND Research Institute based in San Diego, California.


.png)

Comment