
School started on an ominous note this year. On Sept.1, the U.S. Department of Education released disastrous test results. Based on a sample of more than 7,000 9-year-olds around the country, two decades of academic progress in reading and math were erased from 2020 to 2022. But the scores also raised many questions. I will try to answer six of them here. (Thank you to everyone on Twitter who challenged me to explain numbers that seem to be nonsensical and contradictory.)

Q. How can 9-year-olds lose 20 years of academic progress? They weren’t even born 20 years ago.
A. Today’s 9-year-olds today are posting the same test scores in reading and math as an earlier generation of 9-year-olds did back in the early 2000s. In other words, children today are reading and adding about as well as children the same age did 20 years ago.
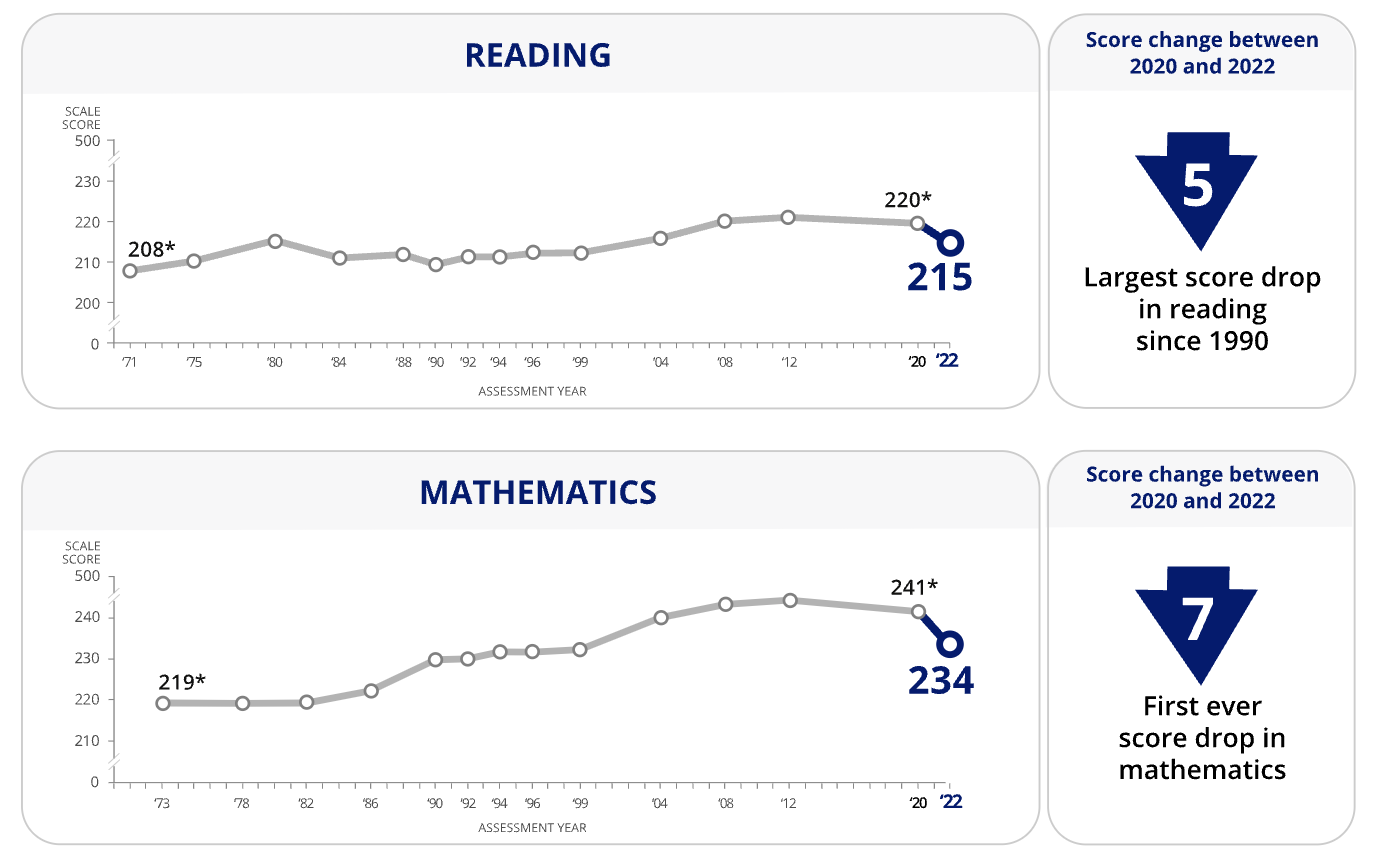
Every few years, the Department of Education administers a test called Long-Term Trend NAEP or National Assessment of Educational Progress to a group of students selected to reflect the diversity of the U.S. student population. Before the pandemic, the reading and math abilities of 9-year-olds had been improving. Scores rose strongly in the 2000s and then flatlined, holding steady in the 2010s.*
This graph from the statistical unit of the Education Department shows the history of the Long-Term Trend NAEP with the sudden plummet in test scores since the start of the pandemic.
Q. Is that really so tragic?
A. One can reasonably argue that it’s not so bad to be back where we were in 2000. Many children born 30 years ago, who would have been about 9 years old then, are educated adults and leading good lives today.
But it is troubling that the lowest achieving students in our schools lost the most ground between 2020 and 2022. Students in the bottom 10 percent in achievement lost four to five times more than students in the top 10 percent. In math, for example, that’s a drop of 12 points versus a three-point drop.
If these children don’t catch up, they will be at a far greater risk of not learning to read well enough to function in our economy or of dropping out of high school because they cannot pass minimum math requirements. Based on another set of plummeting test scores during the pandemic, the consulting firm McKinsey & Company estimated that the current generation of less-educated students could reduce the size of the U.S. economy by $128 billion to $188 billion a year.
Q. How can student achievement around the country be hit so hard if we reported in July 2022 that the pace of learning was back to normal? Was that earlier report wrong?
A. Both reports are consistent with each other and show nearly identical declines in student test scores. The recent Department of Education report reflects just two snapshots of NAEP test scores: one taken in early 2020 before the pandemic and one in early 2022. Between these two time periods, the achievement of 9-year-olds plummeted.
The assessment organization NWEA measures children two to three times during the year using a test called Measures of Academic Progress or MAP, which is taken by millions of elementary and middle school students around the country every year. MAP scores plummeted dramatically in 2020-21 and then started to rebound slightly for many but not all children in 2021-22. Students at each grade level remained far behind where they had been before the pandemic, but they weren’t deteriorating further.
I liken it to the difference between a quarterly and an annual report in finance. A company may be making less revenue today than two years ago, but a quarterly report will show more detailed ups and downs. NWEA’s details show that most of the academic decline occurred in 2020 and 2021, but not so much in 2022. The Department of Education’s NAEP report cannot pinpoint the exact timing of the slide between 2000 and 2022.
Q. So is there learning loss?
A. Students haven’t regressed. It’s not that individual children used to know how to read and then stopped being able to read. The NAEP test implies and the MAP test directly documents that children continued to get better in reading and math during the pandemic. But students missed hours of instruction for many reasons: family tragedies, closed schools, teachers out with COVID, inefficient remote instruction. So students learned less than usual.
My best analogy, which I’ve used before, is a cross-country road trip. Imagine that students were traveling at 55 miles an hour, ran out of gas and started walking instead. According to the NWEA report, now they’re back in their cars and humming along again at 55 miles an hour. Some are traveling at 60 miles an hour, catching up slightly, but they’re still far away from the destination that they would have reached if they hadn’t run out of gas.
It’s this distance from the destination that educators are describing when they talk about learning loss. Some people like to call this problem “missed learning” or “lost learning.” Whatever you want to call it, it means that today’s 9-year-olds – or third and fourth graders – cannot read and multiply as well as 9-year-olds did 10 years ago.
Q. How could scores decline nationally, but not in cities or rural areas?
A. In math, it’s a simpler story. Everyone deteriorated. High achievers and low achievers, along with Black, white and Hispanic students. City, suburban and country students all posted lower math scores.
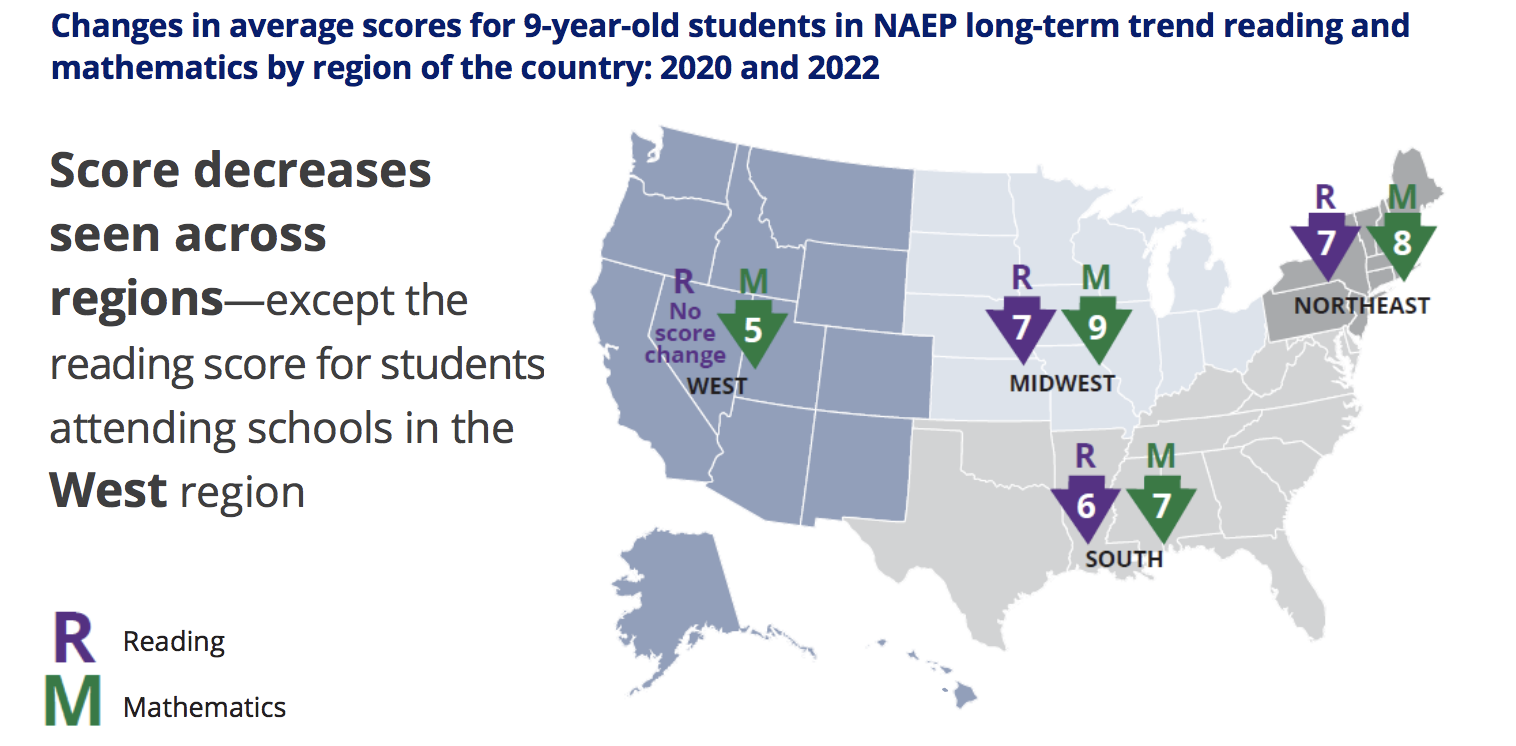
But in reading, test scores in urban school districts didn’t decline between 2020 and 2022. They were also unchanged in rural districts and throughout the West.
I talked with Grady Wilburn, a statistician in the assessment division at the National Center for Education Statistics, who drilled down into the data with me. There were not substantial changes in the racial or income composition of these regions between 2020 and 2022 that could explain why reading achievement held stable. Hypothetically, if cities had gentrified during the pandemic, higher income students would have had higher test scores and could have masked the score declines. But that did not happen.
We also looked at different combinations of race, income and geography. Nationally, Black students scored six points lower in reading, but in the cities, Black 9-year olds scored the same in 2022 as they did before the pandemic hit in 2020. Also unchanged were the scores of white city students, Hispanic city students and city students who are poor enough to qualify for free lunch. In rural areas, both Black and Hispanic students held steady too, but white students in rural areas did deteriorate a bit.
“We were puzzled by these numbers too,” said Wilburn. “Our commissioner has been saying maybe that’s one place that researchers should dive into, to better understand what city and rural communities may have done.”
Meanwhile, the scores of Black, white, Hispanic and free-lunch eligible students in the suburbs as well as small towns all declined sharply during the pandemic. This means that the national declines in test scores were primarily driven by suburban 9-year-olds.
One possibility is that city and rural families read more at home. Perhaps brothers and sisters read to each other. Another possibility is that suburban schools deliver a vastly superior education to students that, in normal times, is very effective in teaching young elementary school children to read well. When school days were disrupted during the pandemic, student achievement suffered more. The more effective school is, the more students might suffer when they get less of it.
Q. Can we tell from this NAEP report whether school closures and remote instruction are to blame?
A. No. But the fact that city schools, where students were most likely to have missed more in-person days, held steady in reading (see above) is a sign that remote learning wasn’t always so detrimental. Suburban and small town students, who tended to have more in-person days, fared worse.
Accompanying the NAEP test was a student survey, which asked students if they learned remotely even once during the 2020-21 school year. But it didn’t ask 9-year-olds to count the number of remote days, so it’s impossible to say if more days of remote school led to worse outcomes.
A separate analysis of NWEA’s MAP scores, circulated in May 2022, found that students who learned remotely lost far more ground. It indicated that remote instruction was the primary driver of widening achievement gaps between rich and poor and between children of color and white students.
A more detailed report from the Department of Education on student achievement during the pandemic is expected in October. It will list state achievement scores for fourth and eighth graders on another NAEP test. Hopefully, we can unravel more of these knots together.
*Correction: An earlier version of this story mistakenly described the history of test scores. Scores rose strongly in the 2000s, not the 2010s.
This story about NAEP scores was written by Jill Barshay and produced by The Hechinger Report, a nonprofit, independent news organization focused on inequality and innovation in education. Sign up for the Hechinger newsletter.
Informed evaluation, or rationalized assessment?
My rebuttal of Hechinger Report
Very detailed and honest report. I have a few questions that I feel we might want to add to our list
“Stat” (statistics) is a four letter word in my view, but please read further so I may explain why. I have seen numerous reports and articles on the learning reports (perceived or real) and I am not seeing how to adjust or more importantly, how to prevent this from happening again?
I am a retired high school Technology teacher and have a different background from many of my academic colleagues which will hopefully explain my perspective. I could write a book on this topic (actually I am in the finishing stages now).
It is an extremely complex topic in that if you tug at one thread, you pull on another. Everything is interconnected and that is where my beef lies with the use of stats and assessment in particular.
If test scores were down, then it is either due to lack of instruction (which there was) or a lack of retention, memory if the testing was on prior learnings. If it is a lack of retention then it proves one point I have felt strongly about for many years. Education is primarily focused on specific outcomes and evaluates itself based on the degree to which those outcomes have been measured.
This brings up two questions. If a loss of retention is to blame, then what does that say about our approach if there are time limits to curriculum and how long it is retained. Currently, final summative assessment takes place at the end of a semester. Is it important that children retain that learning and if so, why do we not evaluate again later on to see what percentage has been lost? Is it possible that what we may believe happened is due to our system of Education, not just the remote learning scenario? How can we know? To assess learning loss over time due to the pandemic, it allowed us the opportunity to test for retention over time. What if the same testing were tried with children in two years after they finished two school years, without interruption?
That might be a fair comparison. It seems we have perhaps made a judgement without knowing the other half of the equation? Does this speak to our infallible belief that once assessed, learning is now deemed permanent?
While I have many other questions that I have been asking myself, I will conclude with this one. Education measures specific outcomes to specific questions where we have expected outcomes. If those outcomes are not achievable, grades are assigned on those results. These assessments are snapshots in time, yet learning is a process that if measured in specific time frames will hurt some children more than others. A child can make great personal success, yet fail to meet the bar. What does that tell the child? Unfortunately we know and it plays out in their confidence levels and self belief systems. After that, no amount of quality teaching is going to correct the damage caused.
Use of a standardized bar is such a harmful exercise. It assumes all children are capable of meeting or surpassing said bar. They are not. They are equal in value and respect, but not abilities. This one key assumption is false and extremely harmful to children and society as a whole. Testing is for the purposes of administration to show accountability for the system and as evidence to parents to show that their children are up to standards or not. In over 16 years of teaching, I can honestly say that I have rarely seen that assessment is used to improve student outcomes. It is a measurement and a judgement, nothing more. If a child gains a 51% average, then it implies that 49% of material covered was either not understood or comprehended. The child moves up to the next level, not knowing almost half of the material required for the next grade level. That is of course if we need in the belief for sufficient prior learnings?
I hear the same arguments again and again in justification for this process. Children have to toughen up, or, they might as well get used to it as this will happen in the outside world (btw, which rarely happens), or my old favourite, we need to assess to show where children are at? One simple question, why this methodology? In my tech classes I hated the use of exams as they were always memory based. If a child was sick, didn’t get enough sleep the night before or were frozen under the pressure of assessment and the time clock, these and more can all impact outcomes. The scores are not always accurate evidence of academic achievement.
Instead I used a different methodology which more closely relates to the “real” world as many in administrative positions dislike hearing. I believed and used “demonstrated outcomes. I looked for evidence that they could use and apply what they had learned. I found it more accurate and it also allowed me to see exactly those areas that students were struggling with. I had a policy of having them either do it over or attempt to fix what was lacking or wrong. Some will say that this would not reflect what they knew on assessment day. True, but if the priority is to improve learning and allow a child to improve, then it seemed to make sense to me. Isn’t the improvement of learning our goal, or has assessment taken precedence?
Since when are Asian and Asian-America n students not part of “everyone.” Their test scores and achievements and struggles are mentioned nowhere in this article about “everyone.” I am tired of reporters conveniently leaving out groups when they don’t support the narrative and at least in some reports, I have read Asian students did not fair as poorly as the “everyone” this article discussed. Please report comprehensively about student achievement.
Asian Americans account for 5 percent of students and their math scores dropped 6 points, very close to the 7 point drop that all 9-year-olds posted, on average. Asian American students deviated from the national trend when it came to reading. They didn’t drop at all while nationally, most other 9-year olds dropped 5 points. Even with the drop in math, Asian Americans remain the highest achieving race/ethnicity.
I take your point that journalists should not leave out Asian Americans when discussing educational achievement, but in this case I didn’t break down the national scores by anyone’s race or ethnicity throughout most of the piece. Toward the very end, I did write about how a statistician at the Department of Education looked at a few racial breakdowns to see if they could explain why reading scores didn’t drop for urban or rural students. That’s quite a puzzle. Asian American students, many of whom live in cities, are part of this puzzle too. How was it that children in some locations were able to make good progress in reading while most didn’t?!
1st, a note on Bill Howe’s comment on statistics– figures don’t lie but liars figure. Take NAEP. Its a lie that NAEP measures learning. Kids learn. States do not learn. NEAP does not tell us what kids learned. NAEP presents state averages. States don’t learn. Kids learn. To measure how much kids learn, the same kid has to be tested twice every school year. I think NAEP (might have been SAT) did that once, and found that the two best state level educational systems were D.C. & MN. DC kids learn a lot while in school, then it goes away over the summer.
We did a a fall-spring 2 tests per kid per yr for 3 years on a nationally representative sample of 60,000 grade 1-3 kids: 1] Nobody learns any math at home. 2]Nobody learns how to read at home. 3] disadvantaged kids learn a lot more during the school yr, so much that it wipes out the start of the yr advantage advantaged kids have. 4] Disadvantaged kids lose everything they learned at school over the summer break.
The stated purpose of high test scores, especially NAEP, is to prepare kids to successfully compete in the future world economy. It does not work. It harms our economy. The 1st international test study was in 1964. US and Sweden were the two lowest scorers. Since then, these have been the most successful economies in history.
In one of my studies of this, I did 169 comparisons between US economy and a higher scoring nation. The theory of the value of high scores predicts that 100% of these economic comparison should have favored the other country. In fact, by a large majority, USA came out on top.
In 2007 I predicted that the misguided emphasis on test scores would harm national productivity. Productivity decline started about a decade ago.