article thumbnail

Data Shows Demographics Are Shifting in Fast-Growing Cities. How Are School Districts Impacted?

Edsurge

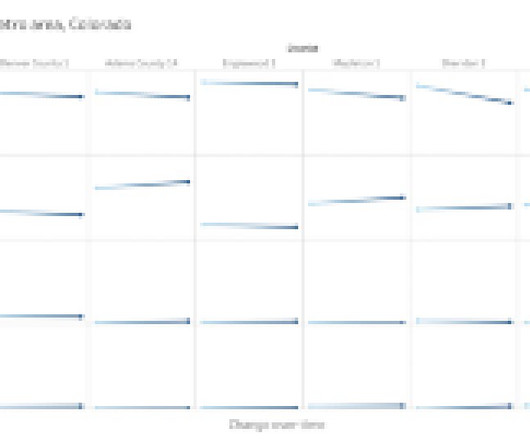
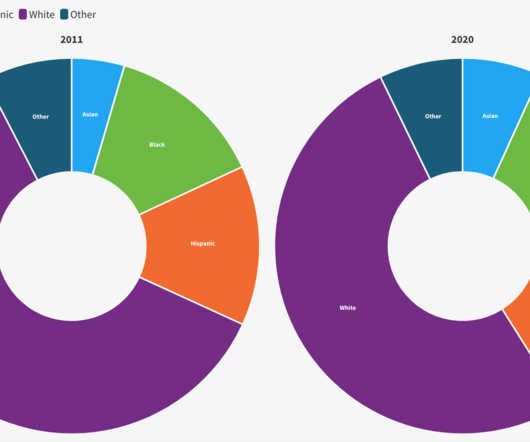
With the release of new data from the American Community Survey, EdSurge decided to take a look at demographic shifts in the school districts of five fast-growing areas around the U.S. The chart compares racial and ethnic makeup of the residents within each school district (not only students) from 2009 to 2021. Census Bureau.

Data 163
article thumbnail

SLIDE: data, interactive tools, and an equity wake-up call (Part 1)

NeverEndingSearch

The project’s newly released Perspectives Report , based on analysis of National Center for Education Statistics (NCES) data, examines school library employment in the United States from 2009 to the latest data available at the time of analysis, 2018-19. almost 20% fewer than in 2009-10. Interactive map of State Survey data.

Data 123
Insiders

Sign Up for our Newsletter

This site is protected by reCAPTCHA and the Google Privacy Policy and Terms of Service apply.

article thumbnail

PROOF POINTS: New evidence of high school grade inflation

The Hechinger Report

The latest is an analysis of more than 4 million high school seniors who took the ACT from 2010 to 2021. One drawback of the study is that it relies on self-reported grades that students disclose on an optional survey when they register for the ACT. points from a 3.0 – a B – in 2009 to 3.11 In a study of actual U.S.

Analysis 143
article thumbnail

PROOF POINTS: New higher ed data by race and ethnicity

The Hechinger Report

The Bureau of Labor Statistics obtains enrollment data from the Current Population Survey (CPS), a monthly survey of households conducted by the Bureau of Census. Census Bureau’s American Community Survey. The zigs and zags in this chart show how college going among Hispanic and Black Americans is influenced by business cycles.

Data 105
article thumbnail

Empty Desks: Getting Chronically Absent Students Back to Class Is No Easy Feat

Edsurge

East Palo Alto Academy, a small charter high school, saw a chronic absenteeism rate of 199 out of 355 students (56 percent) during the 2021-22 school year, according to state data. percent) in 2021-22. In 2021-22, 6.5 In 2021-22, 6.5 percent) during the 2018-19 school year to 846 out of 1,637 students (51.7

Meeting 182
article thumbnail

PROOF POINTS: Rural American students shift away from math and science during high school, study finds

The Hechinger Report

Some of the clues are contained in this June 2021 data analysis conducted by two researchers at Claremont Graduate University and Indiana University. They scrutinized a large federal dataset of more than 20,000 students across the nation who started high school in 2009 and were surveyed through to their third year of college in 2016.

Study 142
article thumbnail

PROOF POINTS: The number of college graduates in the humanities drops for the eighth consecutive year

The Hechinger Report

In 2020, there were only about 37,000 college graduates who had majored in English, down a third from 55,000 in 2009. They were down 10 percent in the spring of 2021 compared to 2020. English language and literature — a major that used to account for a third of all humanities degrees — has been particularly hard hit.

Data 139