

Everybody gets exposed to about 174-newspapers-worth of data on a daily basis*, but how much of that actually catches our attention? Adults and children alike have to be able to read and present data effectively nowadays.
So, if you are looking to create an impact and even explain intricate matters in your classroom, visuals are the most effective tool to do so. Moreover, color visuals increase the willingness to read by 80%.
But making great-looking visuals requires time and advanced designer skills… no more thanks to Vizzlo!
![]()
Vizzlo gives you the power to create sophisticated infographics in seconds right from your internet browser.
With over 100 templates to choose from, Vizzlo could not be easier to use. It is very intuitive, and it makes your experience surprisingly smooth, leaving you with some extra time to browse through Vizzlo’s different examples and descriptions of each chart. Thousands of professors, students, and lecturers from all around the world have already embraced Vizzlo.
It is as quick as selecting the chart you want to use, adding your data, personalizing the format and you are ready!
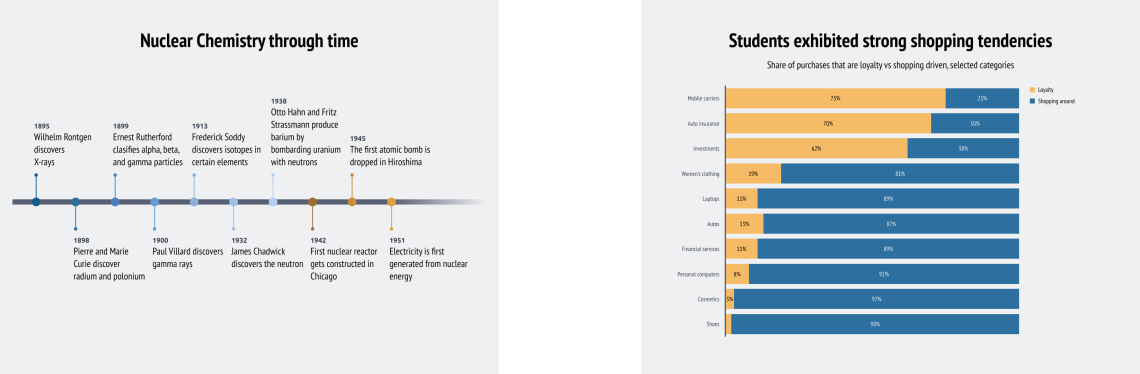
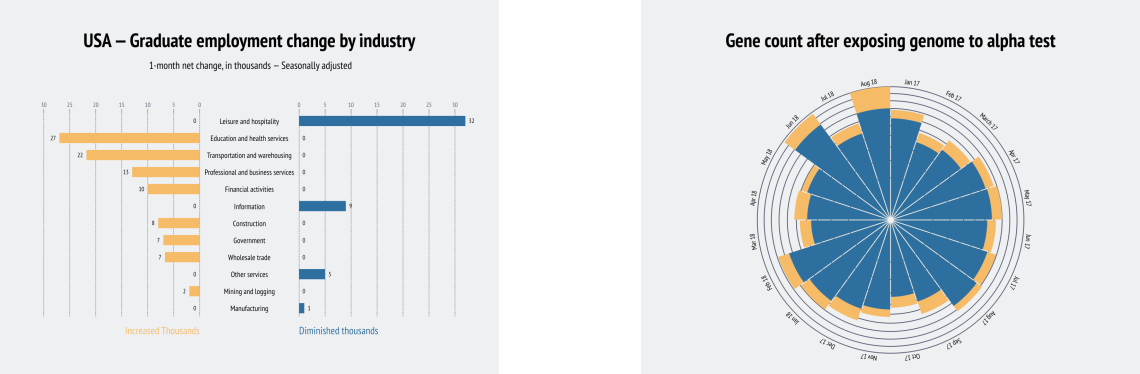
You can create from the straightforward timeline and bar charts, to rich butterfly and Nightingale’s Rose charts.
Vizzlo supports all the features you would expect from a modern cloud-based platform. Your work will get saved automatically, and you can access it again to continue where you left off from all internet browsers, or even directly from PowerPoint. Vizzlo also lets you share links to your fellow mentors with viewing or editing rights and collaborate with them directly in your charts.
Downloading PNG images or high-definition PDFs is available as well so that you can print out your work in billboard-size if you want, or fit it into any screen, without compromising its definition. With Vizzlo you can also organize your charts in folders by class and have your students participate directly on the platform.
Speeding up your work and increasing your productivity is the aim behind all Vizzlo features, saving you up to 50% of the time you spend preparing presentations, and creating your material.
Is it for everybody?
Why yes, it is!
Vizzlo offers a free version which already makes all charts available with the Vizzlo watermark. If you want to go further, you can upgrade to Vizzlo Premium (starting at USD 11 **) or Vizzlo Business which allows you to upload your fonts and collegian image (starting at USD 15**).
Of course, Vizzlo offers special conditions to educators and their students upon request.
If you ever need guidance, Vizzlo’s support team is there for you at help@vizzlo.com, or you can review their tutorials and FAQ in the Vizzlo help center.
Are you ready to start saving precious working hours when preparing your lessons?
* Hilbert, Martin, Mapping the Dimensions and Characteristics of the World’s Technological Communication Capacity During the Period of Digitization (1986-2007/2010) (December 8, 2011). 9th World Telecommunication/ICT Indicators Meeting, International Telecommunication Union, December 2011. Available at SSRN: https://ssrn.com/abstract=2039491
**2 monthly payment in a yearly subscription


1 Comments