We hear all the time “You’ve seen districts implement personalized learning all across the country - give it to us straight - how do we compare?” Whether districts are just getting started and dipping a toe into personalized learning, or are reflecting on several successful years of implementation and searching for ways to go deeper, district leaders want to know how their progress compares to national benchmarks. It isn’t enough to look inward; they need data from the outside too.
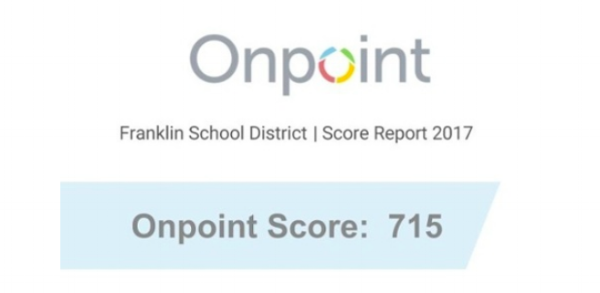
That’s why we’ve developed Onpoint, a single number score compiled from our experience with more than one hundred school districts across the country. It helps district leaders track their implementation progress and narrow their focus for future investments of time and resources. With Onpoint, district leaders validate their own assessment of strengths and weaknesses against the experiences of other districts, and are able to map their personalized learning journey using established mile markers.
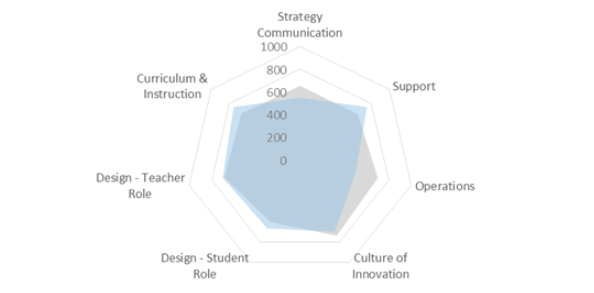
Onpoint combines expert assessment from Education Elements consultants with teacher and leader survey results to arrive at a single number score, which can range from 200 to 1,000. That score has seven components, aligned to our Personalized Learning Implementation Framework. By comparing your Onpoint score to a benchmark derived from a growing dataset of school districts and thousands of survey responses, you can measure your progress and identify where to start or continue your work to implement personalized learning for all students.

Measure and Communicate Progress
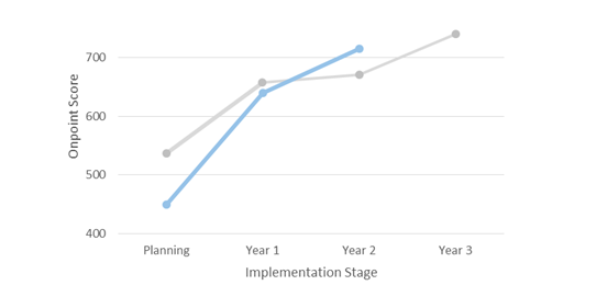
The Onpoint score is a simple way to communicate progress to stakeholders; year over year, the score typically increases as districts become more successful in their implementation. Districts in the planning phase of personalized learning usually score close to 500, and grow their score by more than 200 points, to 700 points, by their third year of implementing personalized learning. Tracking your Onpoint score growth is the easiest way to show that your implementation of personalized learning is on track.


Know Your Strengths and Your Weaknesses
Breaking your Onpoint score down to its component categories shows where to focus your work to increase your success. Often the category breakdowns confirm your expectations. For instance, most districts in the planning phase need to focus on increasing their Strategy Communication score by clearly communicating their vision for personalized learning. Other times, the category breakdowns can yield unexpected insights, like when a district scores low on Culture of Innovation, because their teachers don’t feel as confident innovating and trying new ideas and approaches in their instruction as other teachers in year two of their implementation.
What’s Next
The Onpoint score is based on a growing dataset of districts and thousands of survey responses, and we’re continuing to refine our benchmarks as the dataset grows.
If you think an Onpoint score could help you communicate progress, or determine next steps in your personalized learning implementation, request a free Onpoint score for your district today.
