K-12 Schools Could Save Billions by Sharing Ed-Tech Prices, Report Says
U.S. schools could save at least $3 billion a year on educational technology by sharing information about how much they pay for hardware and software, according to estimates in a new study by the nonprofit Technology for Education Consortium.
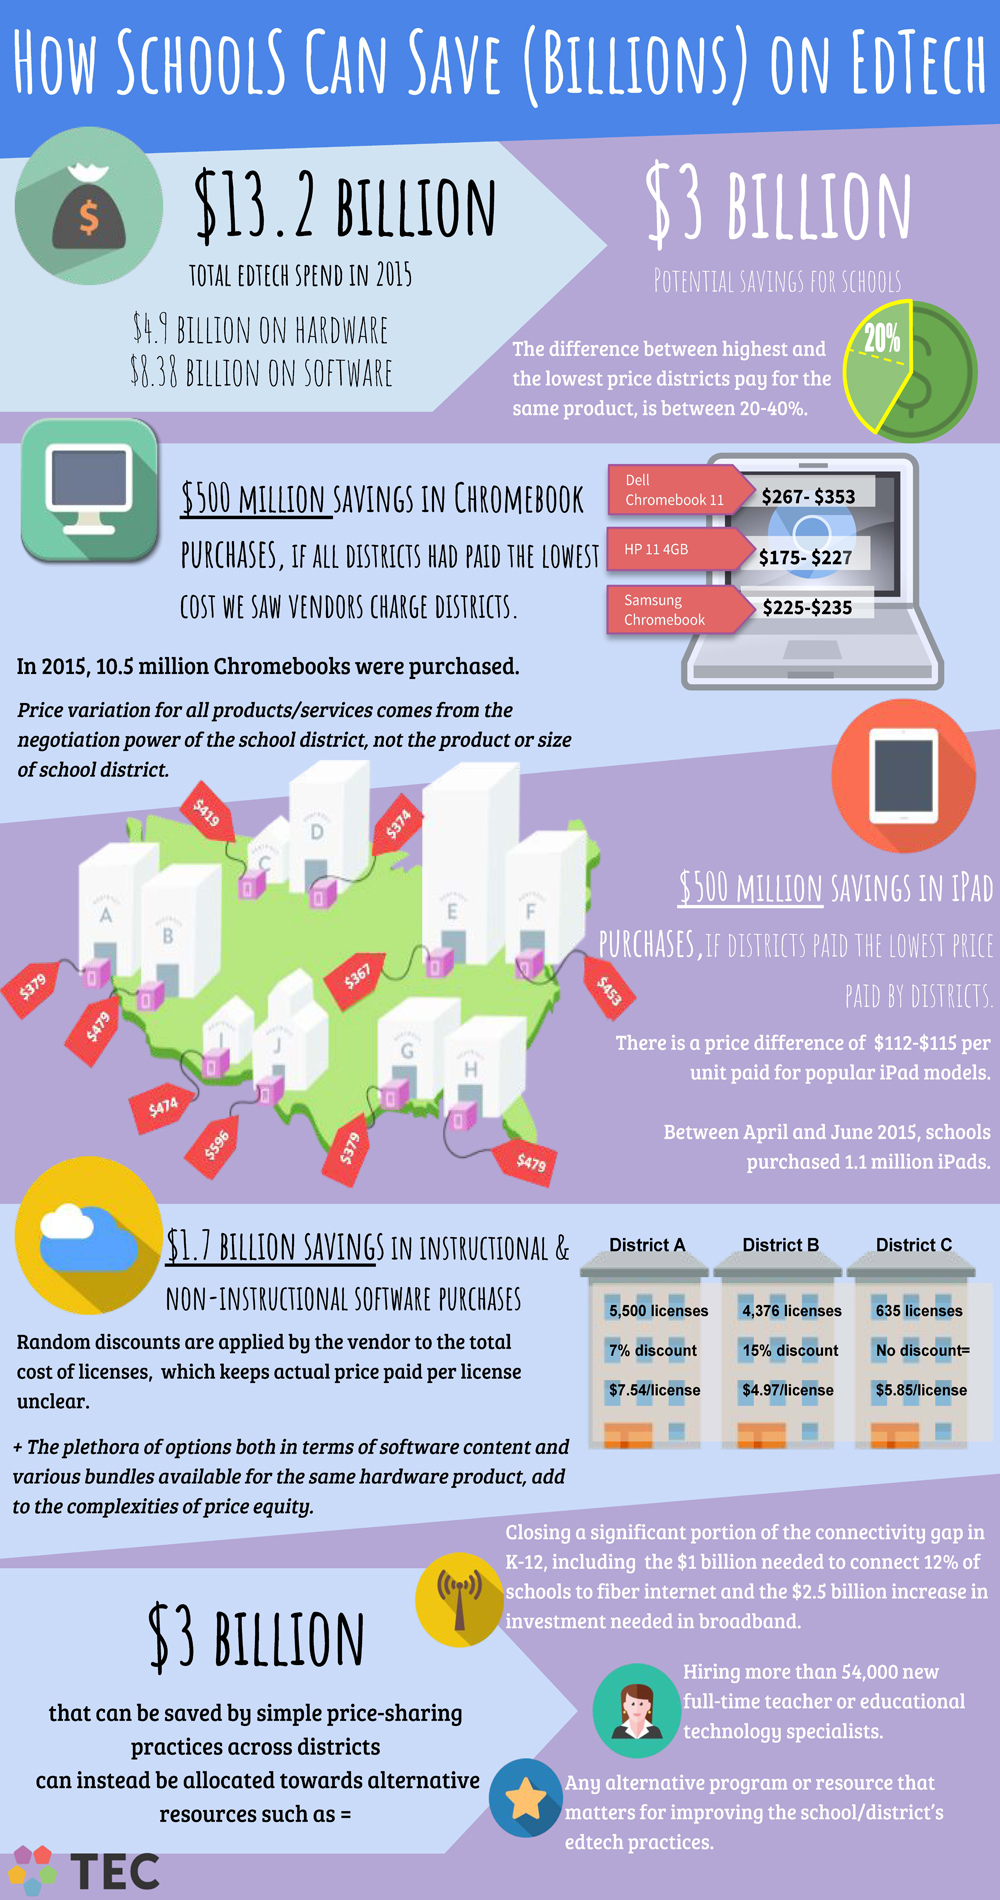
Of that amount, at least $1.7 billion could be saved in instructional and non-instructional software purchases, and $500 million in Chromebook purchases alone, if all districts paid the lowest prices vendors charge, the study’s authors estimated.
Discrepancies between the highest and lowest prices districts pay for the same hardware and software product can range between 20 percent and 40 percent, the researchers found.
The analysis, “How School Districts Can Save (Billions) on Edtech” was released exclusively to EdWeek Market Brief by the Technology for Education Consortium, a nonprofit that wants to bring transparency, efficiency, and collaboration to K-12 schools as they evaluate and purchase ed-tech products and services. The report is now publicly available here.
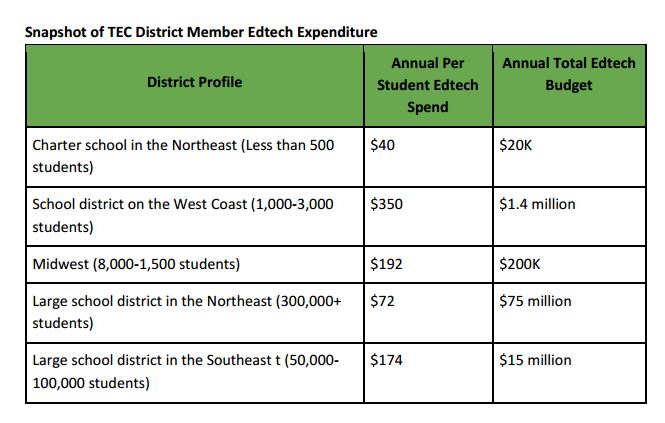
Its findings are based on pricing information shared by 130 small, medium, and large school districts across the country, representing 3.8 million K-12 students and $412 million in total spending on ed tech in 2015. Total potential cost savings were extrapolated, and the billions in projected savings are based on the lower 20 percent differential in pricing for the same products.
Among the findings:
- The prices paid for identical models of Chromebooks with service warranties could be up to $90 higher in some districts than others.
- Licenses for purchases of the same popular software could vary from $4.97 per license to $7.54, depending upon the district;
- There is a price difference of between $112 and $115 per unit paid for popular iPad models.
Hal Friedlander, co-founder and CEO of the consortium, called the numbers “shocking.”
“I know it’s a struggle for school districts to find the money for the programs they want to do,” Friedlander said in an interview. Because funds are tagged with specific requirements within programs, the money for ed tech “often gets pulled out of sofa cushions,” added the consortium official, a former chief information officer for the New York City Schools, the nation’s largest school system.
“The fact that there’s this much opportunity for districts to save money and stretch dollars within their own tech budgets is a good thing,” he said.
Seeing such a large potential savings doesn’t surprise Bart Epstein, the founding CEO of the Jefferson Education Accelerator, who said districts have good intentions about bringing more of a consumer orientation to purchasing. “But the fact that we don’t have mechanisms for simple price comparisons or transparency is indicative of how much work we need to do if we want school districts to be more successful consumers,” he said.
The consortium, founded in 2015, wants to fill in the knowledge gap by encouraging more districts to join their TEC Data Platform, an online library of 4,000 products that K-12 schools can access in exchange if they are willing to provide pricing information anonymously to the database. District leaders that participate can get reports about the actual prices paid by counterparts in similar-sized districts for both hardware and software products in their region.
The anonymity is important, Friedlander said, “because no one wants to be the one who paid too much, and we don’t want to put anyone in the hot seat.” At the same time, districts can ask for a working group of TEC members to discuss the purchase of any particular product.
‘Random Discounts’ Raise Red Flags to Researchers
Comparing the prices districts pay for ed tech is detailed work and analyzing the price points doesn’t always allow for an “apples-to-apples” comparison of software licenses, said Ipek Bakir, an analyst for research and product strategy for the Technology for Education Consortium.
Surveying 95 districts, the researchers found that 360 different ed-tech apps had been purchased. Among the most popular apps bought, there was a 20 percent variance in pricing.
“The plethora of software options makes it difficult for districts to compare prices and negotiate with vendors, which is worrisome because school districts spend more on software content than on hardware,” the TEC report said.
Two of the companies referred to in the report—Renaissance and Imagine Learning—have two of the most popular products purchased by districts in the universe of 130 studied.
“Many factors can influence the price of a license,” said Jeremy Cowdrey, executive vice president of sales and marketing at Imagine Learning, in an emailed response to our questions. “Most vendors offer standard pricing that includes some type of volume discount. We also offer both of these options to all districts. But the reality is that every district partnership requires a unique implementation plan. In fact, most districts issue RFPs listing those specific requirements. And, of course, final pricing will reflect the array of services, support, and professional development options a district chooses.”
Mark Georgiev, the senior director of product management at Renaissance, said the report is comparing the pricing of two different products in its portfolio—Accelerated Reader vs. Accelerated Reader 360—which he said, also via email, accounted for the different pricing structures.
But the report attributed many price differences in software to “random discounts added to district contracts.” License terms are often undisclosed by companies, and there is “no apparent relation between the quantity of licenses purchased and the actual price paid by districts, further underscoring the importance of district negotiation power,” the authors explained.
Friedlander said the discounts seem to reflect the relationship between the buyer and seller, where a vendor might behave differently depending upon the nature of the relationship. Other factors that might influence pricing is what time of year the sale is made and if they know the district is at a point of the year where money has to be spent, they’ll move the overall cost into some target range.”
“Ultimately, the negotiations for these kinds of software purchases shouldn’t be so complex,” said Friedlander. In software, the researchers found that companies charge a base price minus a discount. “It looks like the price breaks are based on volume, but what we’ve found is that [the discounts] aren’t regular, they don’t represent a volume break, aren’t offered upfront and only appear at the end of a negotiation,” he said.
After studying district purchases, Bakir said she could not see a rationale for the price breaks other than as “feel-good discounts” designed to “make the buyer feel good at the end of the negotiation, regardless of the amount of discount applied.”
The consortium prepared the following infographic to depict the potential savings it calculated, and ways those savings could be allocated.
See also:
chloroquin side effects https://chloroquineorigin.com/# hydroxychloroquine eye