THE HACK: COLLECT DATA ON THE WHOLE CHILD
Most teachers make an effort to get to know their students, and many regularly distribute surveys at the start of each school year to speed up that process. The problem is, most teachers read these surveys once, then file them away. Sure, they might have every intention of returning to the surveys and reviewing them later, but far too often, that time never comes. We rely on our day-to-day interactions for relationship building, and although we get to know some students quite well this way, others just fade into the background.
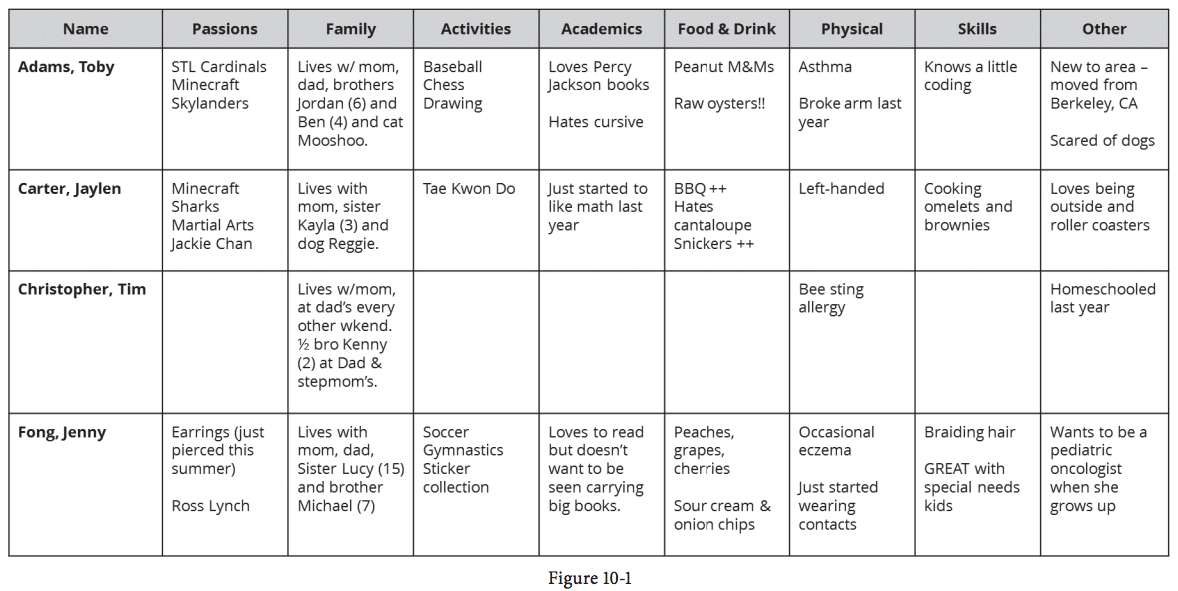
A 360 Spreadsheet is a place for teachers to store and access the “other” data we collect on our students, giving us a more complete, 360-degree view of each student. It’s a single chart that organizes it all and lets us see, at a glance, things we might otherwise forget. Many teachers already keep track of students’ birthdays. Think of this as a birthday chart on steroids. Figure 10-1 is just one possible version of a 360 Spreadsheet:
Because the 360 Spreadsheet is a single document, teachers can access it much more easily than they could a whole folder of surveys. Having the information formatted this way also makes it immediately clear which students a teacher needs to get to know better.
The chart in Figure 10-1 sorts student information into the following suggested categories:
• Passions: What is the student really into? Keeping track of things like hobbies, collections, and other hard-to categorize obsessions will help you connect with your students. This information will boost your ability to help students select books for independent reading, choose topics for writing or research projects, or even better understand math or history concepts by placing them in the context of things they are just crazy about.
• Family: The home environment plays a major role in how well a student performs academically. This category can include information about whether a student lives in one home or travels between the homes of two parents.
It might ask about the number of people who live in the household. It can also include other family-related facts, like whether anyone at home is dealing with an illness, is currently incarcerated, has special needs, travels frequently, or has a noteworthy profession or skill set (Mom is a circus performer? Probably worth noting.)
• Activities: This category will help you better understand what outside activities fill up a student’s schedule when they are not in school. Are they on a sports team? Do they have a part-time job? Will they be busier on certain days of the week or at certain times of the year? Not only will this information give you a more complete picture of who your students are, it will build your awareness of the other demands placed on their time.
• Academics: Here’s where you can put things a standardized test won’t tell you about a student’s academic needs and preferences: If a student struggles with handwriting, expresses a strong desire to work alone, has a strong interest in a particular subject area, or lights up during certain types of activities, record this information; it will help you individualize instruction later.
• Food & Drink: No, you are not a caterer. But why not keep a list of each child’s favorite candy or snack? While you’re at it, record food allergies on this chart as well—the information is probably in the school paperwork already; might as well add it here.
• Physical: Along with conditions that are already listed on students’ official paperwork, this category can include others that are not, but are still important, like needing to use the restroom frequently or the tendency to get cold easily.
• Skills: Our students bring with them talents and skills we may not even be aware of if we don’t ask, so when you find these things out, include them in your chart. Has a student been taking violin lessons for years? Add that. Do they know a lot about dairy farming? Origami? Photography? Put it all in there. Not only will knowing about these skills further develop your knowledge of the student, they may also come in handy when you need help or information about an area where you lack expertise.
• Other: This seems like it could be a throw-away category, but making room for miscellaneous information is a good idea. Things like sensitivities to loud noises, religious practices, or random facts about student histories (e.g., “Lived in China”) should also be recorded, even if they don’t necessarily fit into any broad category. Although these categories offer vital information, they are just suggestions.
Teachers can and should collect whatever information is most relevant to them, information that will help you connect to your students as whole people and build strong relationships with them.
.....
THE HACK IN ACTION
Lisa Tremonte, a special education teacher at Apshawa Elementary School in West Milford, New Jersey, began using a 360 Spreadsheet in the fall of 2014. After giving students a survey, she entered their responses into the chart, then stored the spreadsheet in the front of her planning binder, which made it accessible at all times and enabled her to add to it over the school year as she learned more about her students. “In a quick glance,” she says, “I can access a wealth of information that really matters about my students. I use it to talk to my students about their lives outside of school when we’re saying hello or during lunch and snack time.”
Although the spreadsheet does serve an academic purpose, offering ideas when students struggle to come up with topics for writing assignments, its greater value is that it makes students feel seen. “It enables me to ask students direct questions about the sports they play, teams they love, their pets, siblings, and passions,” Tremonte says. “When I do, the look on their faces says it all. They know that I listen to them, care about them, and think their lives are important. The chart has given me the tools I need to ensure that each child feels loved, safe, and at home in my classroom every day.”
Although education has no silver bullets, building strong relationships with our students comes pretty close. It cuts back on classroom management problems, motivates students to work harder, helps us more effectively differentiate instruction, and generally makes school a better place to be for everyone. The easier you can make it to build those relationships, the more they will pay off for you and your students.

Mark Barnes is a veteran teacher, author, speaker and creator of the Hack Learning Series for teachers and the Hack Learning mobile app. He is the author of six education books, including "Role Reversal." His book, "Assessment 3.0," encourages teachers to eliminate traditional grades and build an ongoing conversation about learning. He is the publisher of the Brilliant or Insane blog and can be found on Twitter at @markbarnes19.