K-12 District Spending Analysis Raises Red Flag About ESSA School Comparisons
A study of school district spending patterns in 2016-17 has found it can be difficult to track equitable use of resources across schools because of the way budgeting is done and spending is reported.
This discrepancy is of particular concern as schools are expected to report per-pupil spending at the school level in 2018-19 to comply with requirements under the Every Student Succeeds Act, according to Jess Gartner, the CEO of Allovue, the company that released the analysis.
For instance, the study found that about 65 percent of all district dollars were spent at the school level, but only 48 percent of districts’ budgeting was done at that level, according to the research by Allovue, a company with a software platform used by school districts to create and plan budgets and monitor spending. The rest of the dollars are budgeted centrally from the district office.
“That opens the door to a lot of inequity because it’s very hard to see how the other 50 percent of the dollars are actually benefitting students at schools,” said Gartner. (My colleague Daarel Burnette II has written about this requirement of states under ESSA and the fact that these calculations of true costs can be elusive in districts.)
Although it is not yet required, submitting this data from 2016-17 as part of compliance with ESSA regulations would have produced “a really inaccurate depiction” of what schools are spending, she said.
“Our recommendation is that 90 percent of dollars are budgeted and spent at the school level,” said Gartner, a former middle school teacher who founded the company after being frustrated over inequities in spending priorities from school to school in the district where she taught. “But the budgeted amount [for schools] is about half of that right now.”
Less Spent on Salaries, More on Services
The study was the first full-year analysis done by Allovue, and it was based on data from districts ranging in size from 1,000 to 60,000 students in rural, suburban and urban settings around the country. The study is a representative sample of 1 percent of the total districts in the country, according to the company.
How were these districts’ dollars spent in 2016-17? The following chart of general fund expenditures shows that districts spent 5 percent less for salaries and benefits than was budgeted, but spent 36 percent more for services than budgeted.
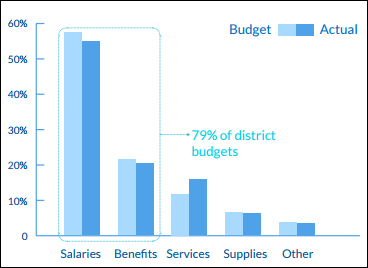
The “services” category in school budgets studied is consistently overspent, Gartner said. In that bucket are third-party providers like consultants, audit services, strategy services and professional development. It also could be money spent on maintenance services, she said.
Spending less on salaries and benefits is often an expected outcome, Gartner said, as vacancies aren’t yet filled and savings accrue. That saving becomes a buffer when money is needed for other purposes in a district.
The Allovue analysis also looked at how money is spent every month throughout the year:
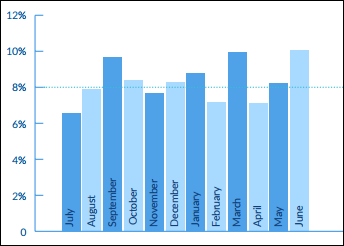
On average, districts spend about 8 percent of their budgets each month. However, spending jumps in the beginning, middle, and end of the school year, which the company attributed to “a surge in supply requests, increases in professional services, and staffing costs.”
“This spending graph looks very different for the general fund than it would for grant funding, which is heavily backloaded at the end of the year,” in the March-June timeframe, said Gartner.
Follow EdWeek Market Brief on Twitter @EdMarketBrief or connect with us on LinkedIn.
See also:
partner Equiday CEO Justin Dayhoff facilitates abuse and child molestation perpetrated by his father. He victim blames and harasses. #metoo https://tongueofpan.blogspot.com/2019/03/im-afraid-theyre-going-to-send-someone.html