5 Principles for Evaluating State Test Scores
What’s the best way to know what’s going on in schools? The answer, of course, is to visit the school, talk to the staff and students, and observe the learning process. What’s the easier way? Looking at proficiency data. For better or worse, standardized test scores are simple for anyone to access, typically a link or two away on the web. But as Mitch Slater, Co-Founder and CEO of Levered Learning, pointed out in his edWebinar “A Little Data is a Dangerous Thing: What State Test Score Summaries Do and Don’t Say About Student Learning,” looking at data from one set of assessment scores without context is virtually meaningless. While educators should track performance data to help inform their overall view on a district, school, or class, they need to keep in mind basic data analysis principles to ensure that they aren’t getting a false image of their students’ achievement.
Prior to looking at data, educators need to avoid two major pitfalls. First, data analysis is reductive; details about the data are lost when aggregated at the school, district, or state level. Although it can offer perspective on the larger performance advancements and issues in a school or district, Slater says administrators need to be careful not to lose the meaning of what the data is showing. Second, school leaders need to be mindful of sample size when drawing conclusions. Too often, decisions are made based on a small percentage of students whose information doesn’t accurately reflect the needs of their peers.
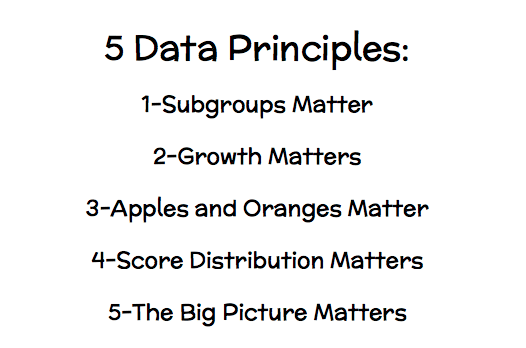
To combat these data pitfalls, Slater adheres to 5 Data Principles.
- Subgroups Matter: Even though demographic data is collected for assessments, constituents often just look at the overall, aggregate score as an indicator of success or failure. It’s within these subgroups, though, where administrators can see if they are effectively serving their entire student population. On the other hand, subgroup data should not be used to make predictions about student achievement. It’s only meaningful if applied to a large sample size.
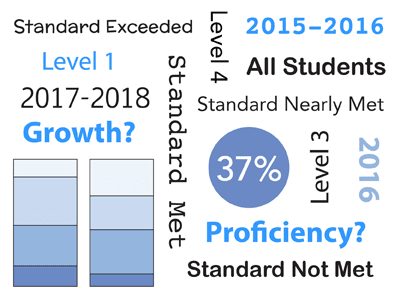
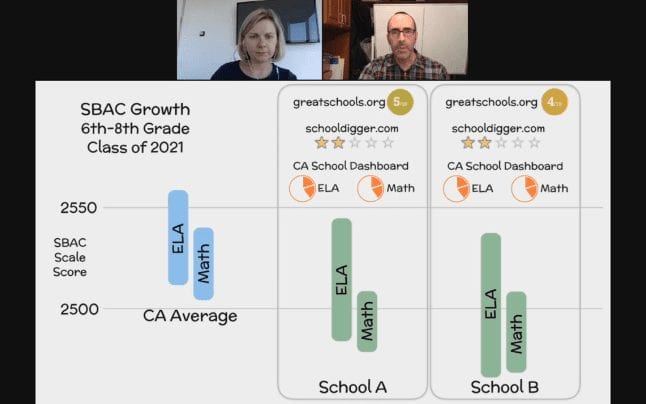
- Growth Matters: No one should just look at the end point of a school year or focus on a single year at a time. Educators can miss, then, when students are racing ahead or falling behind. They need to look at the growth story as well as whether or not the students are meeting proficiency standards.
- Sample Size Matters: When looking at changes within a year or from one year to the next, it’s important to look at the same cohort. Otherwise, educators will see variations in data that aren’t relevant to actual student achievement but could just be symptomatic of students moving away or an increase or decrease in student body for a particular demographic.
- Score Distribution Matters: Most state assessments have four or five levels on the proficiency scale, and it’s common to just focus on the number of students meeting or exceeding the standards. By ignoring the lower levels, though, school officials are missing the larger story. For instance, is the number of students nearing proficiency increasing or decreasing each year? Are there common characteristics among the students at the lowest level? The changes in distribution matter as much as the number of proficient learners.
- The Big Picture Matters: While most educators assume that the data is indicating success or failure at the class or school level, it’s often showing a bigger picture about the district.
Finally, Slater reminded attendees that there are limitations to data in general, but particularly if removed from actual classroom observation. “[It’s] the power of and. We should pay attention to the quantitative but always look at it in the context of the qualitative and the bigger picture,” said Slater. “The data can be a great place to uncover interesting things that are happening, but then you have to follow up with the qualitative and flesh out the whole story.”
This edWeb webinar was sponsored by Digital Promise.
This article was modified and published by EdScoop.
About the Presenter
Mitch Slater is the CEO and co-founder of Levered Learning, an education company facilitating best instructional practices through classroom-tested, all-in-one blended learning systems. Before starting Levered, Mitch enjoyed a 20-year career as a classroom teacher and administrator in grades 3-12. Levered’s unique instructional approach is based on a pencil and paper adaptive curriculum that Mitch developed and fine-tuned for 12 years in his own classroom. As a result of his educational background in the sciences, Mitch is also a self-proclaimed data nerd.
About the Host
Christina Luke, Ph.D. leads the Marketplace Research initiative at Digital Promise which is focused on increasing the amount of evidence in the edtech marketplace. Before joining Digital Promise, Christina led program evaluations for federal and state initiatives and delivered professional development and technical assistance to school districts at Measurement Incorporated. Formerly a high school English teacher, Christina left the classroom to study education policy with a desire to improve student outcomes by offering a practitioner’s perspective to education research. Christina earned a Ph.D. in education administration and policy from the State University of New York at Albany and a bachelor’s degree in secondary education and English from Boston College.
Join the Community
Research and Evidence in Edtech is a free professional learning community on edWeb.net that brings together researchers, educators, and product developers to share best practices related to edtech research and evaluation.


Comments are closed.