
I tell them this:
Just think of hashtags as subjects.
There are the standard, popular subjects (much like the subject categories of the Dewey Decimal System -- but I keep this reference to my librarian self). Also, anyone can create their own hashtag to designate a group, to express emotions, to editorialize -- for anything, really.
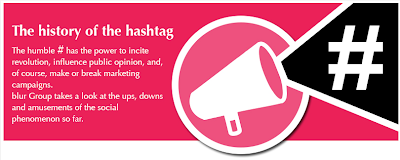
Now when people ask, I will have a nice little infographic to show them. It's informative and entertaining and it was created by blur Group, a global technology company that specializes in ecommerce.
According to the infographic, Chris Messina first suggested using hashtags for Twitter groups in 2007. Tumblr followed later that year, Instagram started using hashtags in 2010, Google Plus hopped on the bandwagon in 2011, and Flickr barely beat out Facebook to avoid last place in 2013.
Covered in the infographic are the hashtag's effect on politics, the entertainment industry, and business.
These are my favorite factoids:
•The most popular hashtag on Instagram (2011)
•The positive effect of the hashtag #40dollars (2011)
•How #McDStories backfired on the company (2012)
•The success that the hashtag #Nike has enjoyed (2013)Click on the image and see for yourself:
Happy #hashtagging, and have fun with it!
(◕‿◕✿ )
G+
P.S. These are four of my most favorite hashtags :
#edchat in Google Plus and Twitter
#edtech in Google Plus and Twitter
#GAFE (Google Apps for Education) in Google Plus and Twitter
#TLChat (Teacher-Librarian Chat) in Google Plus and Twitter